
The average home rose to £476,026 in July, up 3.0% on a year ago, down from 5.1% in June. Semis rose fastest, flats slipped, and Oxford is still cheaper.
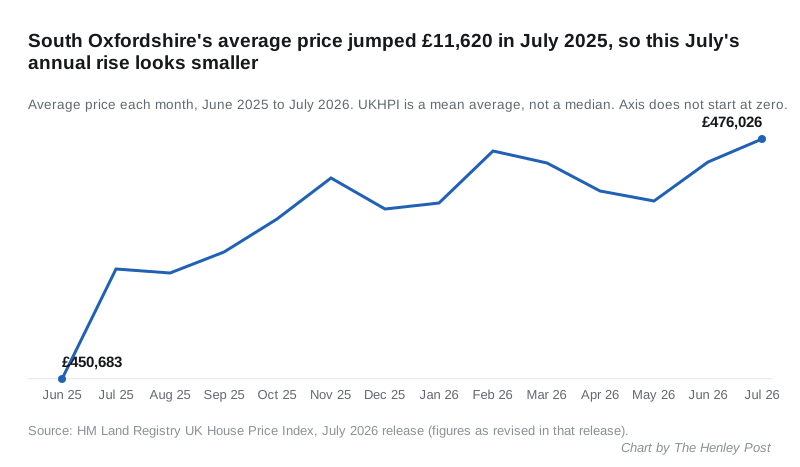
The average South Oxfordshire home was worth £476,026 in July 2026. That is the district’s highest figure since October 2022.
Prices were up £13,723, or 3.0%, on July 2025. A month earlier the annual rise was 5.1%. The figures come from HM Land Registry’s UK House Price Index for July, published in September.
The slowdown is mostly about last summer, not this one. Prices rose 0.5% between June and July this year. In July 2025 they jumped 2.6% in a single month, from £450,683 to £462,303. Measured against that higher starting point, this year’s rise looks roughly half the size.
Which homes rose, and which did not
Every main type of home rose in value except flats. The UKHPI averages for July 2026, with the change on a year earlier, are:
| Property type | Average price, July 2026 | Change on July 2025 |
|---|---|---|
| Detached | £780,125 | up 2.9% |
| Semi-detached | £455,911 | up 4.0% |
| Terraced | £374,711 | up 3.4% |
| Flat or maisonette | £237,655 | down 0.1% |
| First-time buyer | £383,299 | up 3.2% |
Semi-detached homes rose fastest. Flats were the only type to lose value, and only just.
Buyers with a mortgage paid an average of £478,019, up 3.1%. Cash buyers paid £471,176, up 2.6%.
South Oxfordshire against its neighbours
South Oxfordshire’s 3.0% rise is well ahead of England’s 1.1% and the South East’s 0.2%. Two of its Oxfordshire neighbours rose faster. Most of its Berkshire and Thames Valley neighbours fell.
| Area | Average price, July 2026 | Change on a year |
|---|---|---|
| Vale of White Horse | £413,773 | up 5.7% |
| Cherwell | £356,935 | up 4.7% |
| South Oxfordshire | £476,026 | up 3.0% |
| Oxfordshire | £420,093 | up 2.4% |
| Buckinghamshire | £479,736 | up 1.1% |
| England | £293,479 | up 1.1% |
| West Berkshire | £403,682 | up 0.4% |
| South East | £380,878 | up 0.2% |
| Wokingham | £496,537 | down 0.9% |
| Reading | £349,550 | down 1.2% |
| West Oxfordshire | £418,586 | down 1.6% |
| Oxford | £471,667 | down 2.3% |
| Windsor and Maidenhead | £575,036 | down 3.9% |
All figures are from the same UKHPI July 2026 release.
Two comparisons stand out for this district:
- Oxford is still cheaper. In June the district’s average passed Oxford’s for the first time since December 2021. In July the gap was £4,359, with Oxford at £471,667.
- Buckinghamshire is now only £3,710 dearer. Its average fell 2.0% in a single month, to £479,736. That is the county across the border from Thame and Chinnor.
What it means for you
- The number is a district average. UKHPI is a mean average, not a median, modelled across the whole district from Didcot to the Chilterns. It shows the direction of travel well. It is a poor guide to what a particular house is worth.
- Henley costs far more than the average suggests. Actual sales in the Henley town sectors had a middle price of £600,000 over the twelve months to June, against £350,000 in Didcot. Our Henley house prices page breaks sales down by town, property type and street.
- Recent months can still move. The Land Registry revises figures as late sales are registered. June’s district average was revised down from £474,283 to £473,587 in this release, and June’s annual rise from 5.2% to 5.1%.
- Selling a flat? Flats have not moved in a year, while houses are still rising. The gap between flat and terraced prices is now £137,056.
We reported the June figures in August. The August 2026 index is due in October.
Have your say