
1,755 South Oxfordshire residents claimed jobless benefits in September: 1.9%, against 4.1% for England. Henley and Thame's rate was 1.7%.
1,755 people in South Oxfordshire were claiming unemployment-related benefits in September. That is 1.9% of residents aged 16 to 64, according to the ONS claimant count for the district. The rate for England was 4.1%.
The figure for the Henley and Thame parliamentary constituency was lower still. It had 990 claimants in September, or 1.7%, in the same ONS series for the constituency.
Where South Oxfordshire ranks
Only eight of England’s 296 council areas had a lower rate in September. South Oxfordshire was one of five areas on 1.9%, alongside West Oxfordshire, Derbyshire Dales, Mole Valley and Bath and North East Somerset. We ranked every English council area in the ONS September table ourselves. Hart, in Hampshire, was lowest outside the City of London and the Isles of Scilly, at 1.7%.
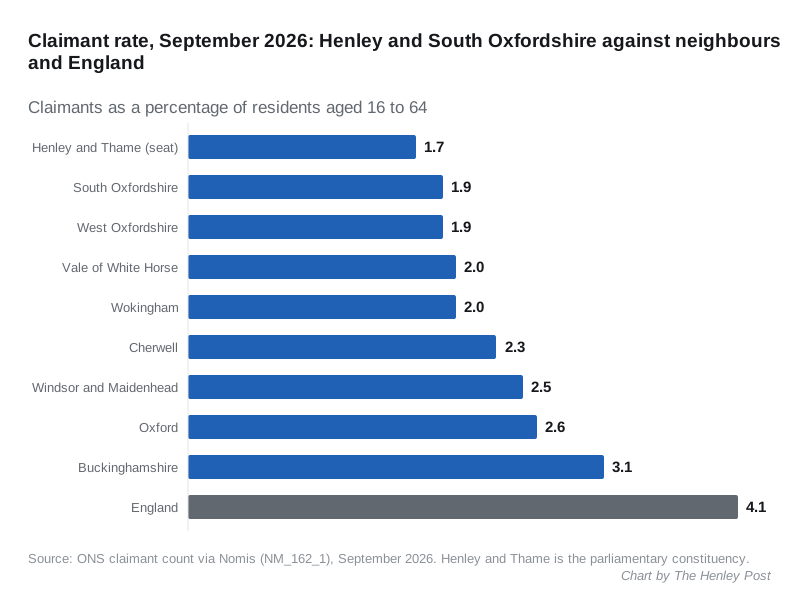
The neighbouring areas, all in the same ONS release:
| Area | Claimants, September 2026 | Rate |
|---|---|---|
| Henley and Thame (constituency) | 990 | 1.7% |
| South Oxfordshire | 1,755 | 1.9% |
| West Oxfordshire | 1,405 | 1.9% |
| Vale of White Horse | 1,835 | 2.0% |
| Wokingham | 2,325 | 2.0% |
| Cherwell | 2,490 | 2.3% |
| Windsor and Maidenhead | 2,465 | 2.5% |
| Oxford | 3,095 | 2.6% |
| Buckinghamshire | 10,915 | 3.1% |
| England | 1,493,875 | 4.1% |
Up on August, down on a year ago
The district’s count rose by 45 between August and September, from 1,710. That is a small move on a base this size. Every monthly figure over the past year has sat between 1,710 and 1,850.
Over the year it fell slightly. There were 1,770 claimants in September 2025, so this September’s figure is 15 lower. England went the other way: its count rose from 1,456,065 to 1,493,875 over the same twelve months.
The district is still well above where it was before the pandemic. In September 2019 there were 945 claimants. The count peaked at 3,220 in May 2020 and has not fallen below 1,550 since.
Over-50s are the only group up on the year
The ONS splits the count into three age bands. Comparing September 2026 with September 2025 for the district:
- Aged 16 to 24: 235, down from 260
- Aged 25 to 49: 1,025, down from 1,035
- Aged 50 and over: 495, up from 475
The changes are small. But the over-50s are the only band with more claimants than a year ago, and the 16 to 24 figure is the lowest of the past twelve months.
What the figure does and does not measure
The claimant count is not the unemployment rate. It counts people claiming Jobseeker’s Allowance, plus people on Universal Credit who are required to look for work. Some of those Universal Credit claimants already have a job but earn too little to leave the search requirement. People who are out of work but claim nothing are not counted at all. It is still the only jobs measure the ONS publishes every month for an area this small.
What it means for you
- Local vacancies are on our Henley jobs page.
- If money is tight, check whether you qualify for a council tax reduction on our Henley council tax bands page.
The October figures are due from the ONS next month. We will report them when they are published.
Have your say