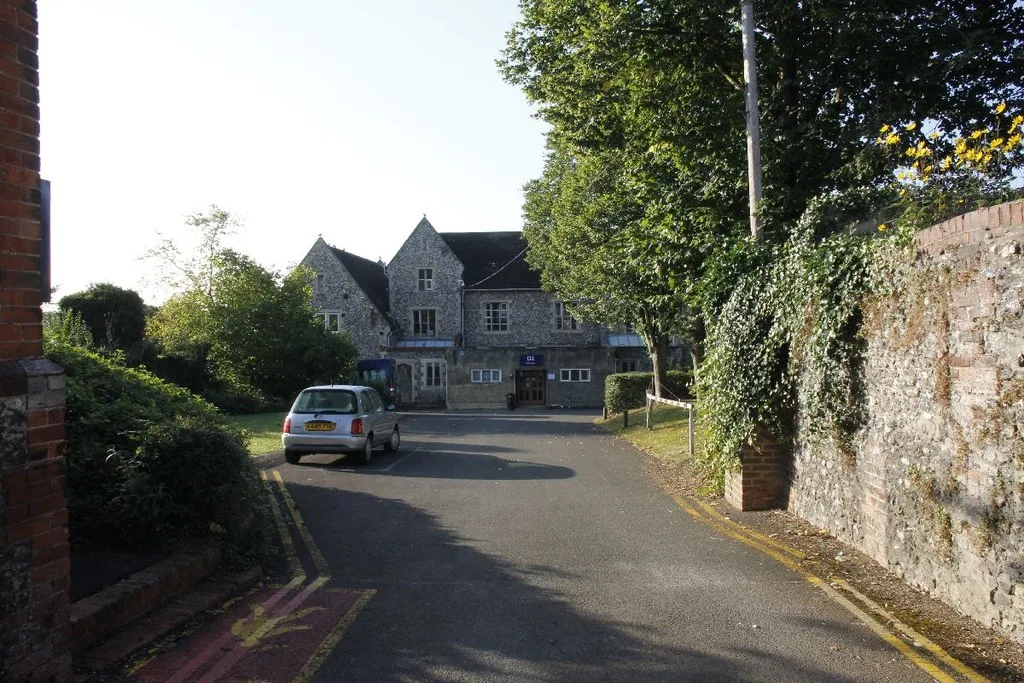

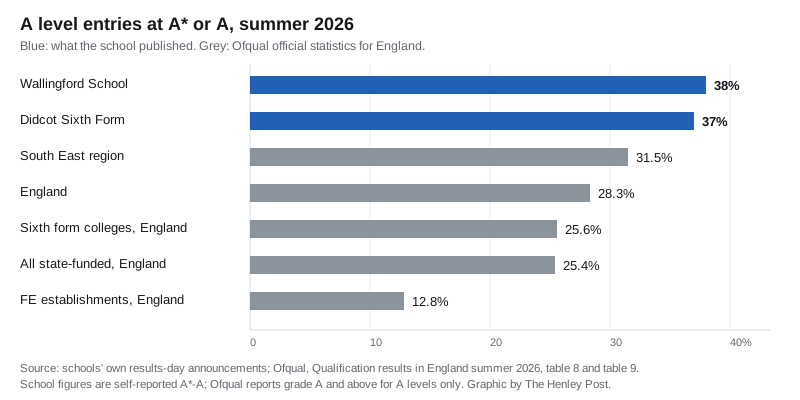
Wallingford School reported 38% of entries at A* or A and Didcot Sixth Form 37%, against 28.3% for England. The Henley College published a 95.5% pass rate.
Sixth formers across South Oxfordshire collected A level results on Thursday 13 August, and the district’s four biggest centres published four very different sets of numbers. Two gave a full grade breakdown, one gave a pass rate and no top-grade figure at all, and one gave neither.
Here is what each of them actually reported, and what the national statistics say those figures are worth.
Wallingford School: 38% at A* or A, up from 31%
Wallingford School published the fullest set in the district. Across its 153 Year 13 students, 14% of all entries were graded A*, 38% were A* to A, 68% were A* to B and 98% were A* to E.
Every one of those bands is up on the school’s own 2025 figures, which it published as 10% at A*, 31% at A* to A and 60% at A* to B. (Wallingford School, Key Stage 5 Results 2025) The one measure that fell is the bottom of the scale: 100% of entries reached A* to E last year, 98% this year.
Headteacher John Marston said: “This has been a talented year group which has worked tremendously hard and made a significant contribution to our school both within the classroom and beyond.”
Didcot Sixth Form: 37% at A*/A, third rise in a row
Didcot Sixth Form, the joint provision run by Didcot Girls’ School and St Birinus School under the Ridgeway Education Trust, reported 37% of A level entries at A* or A, up from 35% last year and 31% the year before. It recorded 65% at A* to B, matching its record, and a 99% pass rate, also matching its record.
The schools said the results “reflect not only their academic ability and hard work, but also the encouragement of their families and the expertise, dedication and care of staff across both schools”. The announcement gave no cohort size and no subject breakdown.
The Henley College: 95.5% pass rate, no top-grade figure published
The Henley College is by some distance the district’s largest A level centre, and it entered 1,190 A level results this summer. It published a 95.5% pass rate, which it said was above its 2025 performance, and picked out three subjects: Classical Civilisation at 30.8% A* to A and 46.2% A* to B, Photography at 58.3% A* to B and 75% A* to C, and Geography at 40% A* to B.
What it did not publish is an overall A* to A or A* to B figure for the college as a whole. Readers comparing Henley with Wallingford or Didcot this week have no like-for-like number to compare, because the college has not put one out.
On the vocational side the college reported a 100% T Level pass rate, against a national figure it gave as 92.6%; a 99.4% pass rate on Extended Diplomas; 67% of BTEC students at DMM or above, which the college describes as equivalent to ABB at A level; and 47.1% of UAL Extended Diploma students at Distinction. Ofqual’s published data tables do not carry an overall T Level pass rate, so the 92.6% comparison is the college’s own citation rather than something a reader can check in the official statistics.
Principal Simon Spearman said there are “many different routes to an ambitious destination”, pointing at degree apprenticeships and employment alongside university. The college’s own results-day announcement featured students who had travelled in from Reading, Woodley and a Wokingham free school, which is a reminder that its catchment crosses the river: see our guide to Henley trains and travel.
Lord Williams’s School, Thame: a count, not a percentage
Lord Williams’s School in Thame said 31 students achieved three or more grades at A*/A or equivalent and that the vast majority of university applicants got their first choice. It published no percentages and no cohort size, and the figure covers A levels, BTECs and Cambridge Technical qualifications together, so it cannot be set against anyone else’s A level percentage.
Headteacher Neil Dimbleby said: “This is a wonderful set of results for our Year 13 students, many congratulations to every single one of them.” Head of Sixth Form Sean Wilson said the results “reflect the hard work and commitment of all our students”.
Wheatley Park School had not published any 2026 A level figures when this was written; its exam results page still ended at 2025.
What the national figures say
Ofqual published its official statistics at 9.30am on results day. England came in at 28.3% of A level results at grade A or above and 78.1% at grade C or above, across 835,950 results issued to 320,505 students at 2,835 schools and colleges. Both headline figures are the highest of the four years the table shows: A and above ran at 28.2% in 2025, 27.6% in 2024 and 26.6% in 2023.
The South East, the region South Oxfordshire sits in, beat England on both counts at 31.5% at A or above and 79.5% at C or above, from 166,940 results. Only London did better, at 32.7%. (Ofqual, Qualification results in England summer 2026)
Type of centre moves the numbers far more than region does. Ofqual’s centre-type table puts independent schools at 48.6% at A or above, grammar schools at 43.4%, free schools at 27.0%, sixth form colleges at 25.6%, academies at 23.5%, local authority maintained comprehensives at 23.0% and further education establishments at 12.8%. All state-funded centres together reached 25.4%.
Why these figures are not like for like
This is the part results-day coverage usually skips, and it changes how the local numbers read.
Ofqual reports A levels only, and only two bands: grade A and above, and grade C and above. Schools and colleges publish what suits them, and several fold other qualifications in. Lord Williams’s counts A levels, BTECs and Cambridge Technicals together. The Henley College reports T Levels, BTECs and UAL diplomas on three separate scales.
So the comparisons hold up to different degrees. A* or A against Ofqual’s “A and above” is a fair match, which makes Wallingford’s 38% and Didcot’s 37% genuinely above the England figure of 28.3% and above the South East’s 31.5%. A* to C against “C and above” is roughly fair. A* to B has no national equivalent at all, so Wallingford’s 68% and Didcot’s 65% can only be set against their own previous years, never against a national average or against each other’s different qualification mixes.
The benchmark also has to fit the centre. A sixth form college’s national comparator is the 25.6% for sixth form colleges or the 12.8% for further education establishments, not the all-England number that folds in every grammar and independent school in the country.
Why a South Oxfordshire ranking would mislead you
Since 7 August, Ofqual has published an interactive map of A level outcomes down to local authority district, and results-day league tables elsewhere lean on it. For this district the ranking would be close to meaningless.
Ofqual states that all grades and students are assigned to geographical areas “based on the postcodes recorded for exam centres in the National Centre Number (NCN) register”. Grades are counted where the exam was sat, not where the student lives. (Ofqual Analytics, A level grade outcomes by administrative area) South Oxfordshire contains a large college drawing students from Berkshire and independent schools drawing from a wide area, and sends teenagers out to Oxford, Reading and Aylesbury in return. The district figure counts the first group and misses the second.
What it means for you
If a grade looks wrong, the clock is already running. For A levels, T Levels and Level 3 vocational qualifications, the priority review of marking deadline is 20 August 2026, seven days after results day, and awarding bodies must complete it within 15 calendar days. That is the route for anyone whose university place depends on the outcome.
The standard review of marking and the clerical re-check both close on 24 September 2026, turned round within 20 and 10 calendar days respectively. Access to scripts requests also close on 24 September. (JCQ post-results services)
Two things families regularly get wrong. The request goes through the school or college’s exams officer, not direct to the exam board, and it needs the student’s written consent. And there is no grade protection: a review can lower a mark and a grade as well as raise it.
GCSE results follow on Thursday 20 August, the same day the priority review deadline falls. Wallingford School has told families its Year 11 results day opens at 10am that morning; check your own school’s collection time rather than assuming, because they differ across the district.
Have your say